Facts & Figures
The families we work with and represent come in all shapes, sizes and forms – no two one-parent families are the same. Here are what the key facts and figures about one-parent families in Ireland show.
About One-Parent Families in Ireland
- 1 in 5 people in Ireland live in a one-parent family.
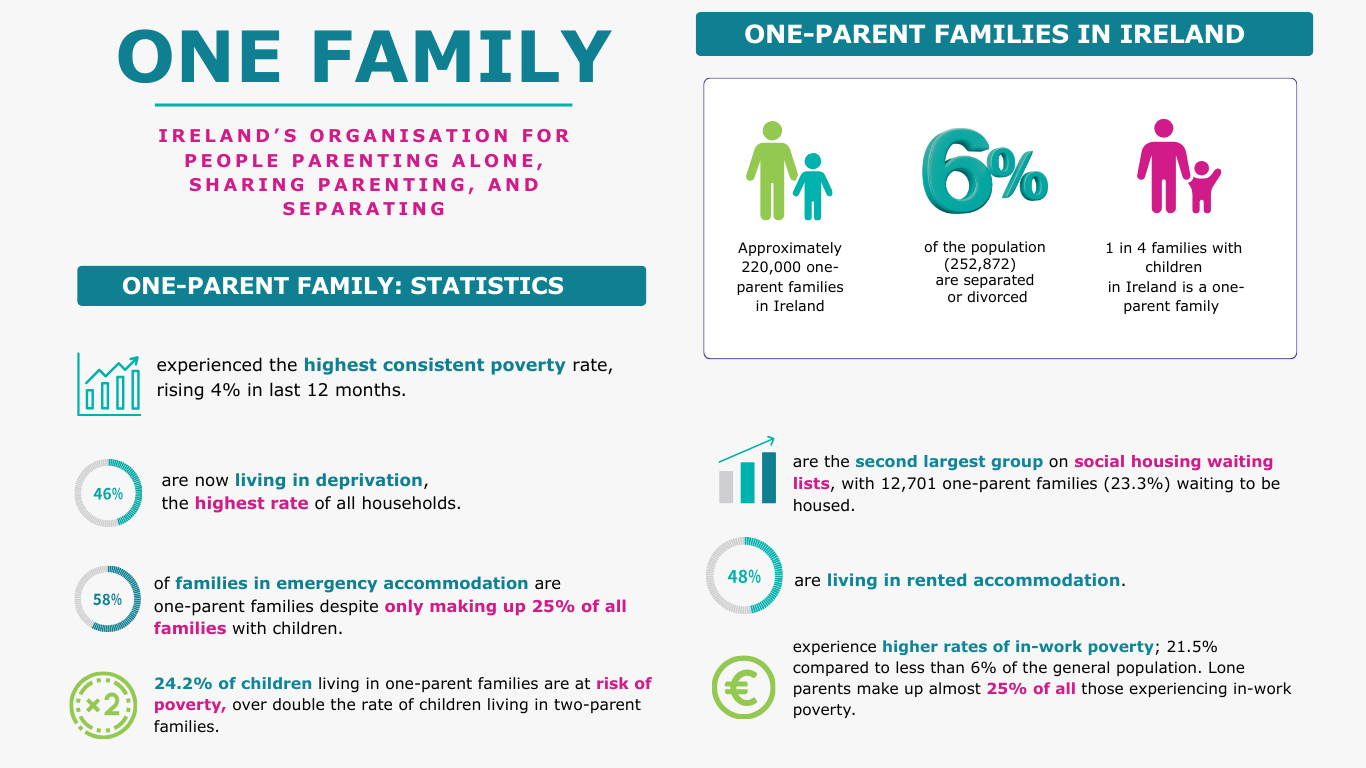
- 1 in 4 families with children in Ireland is a one-parent family.
- 86.4% of one parent families are headed by a mother, and 13.6% by a father.
- The number of one-parent families headed by a parent aged 15-34 has decreased, while the number of one-parent families headed by a parent aged 35+ has increased.
- There were 218,817 (25.4%) family units with children (of any age) headed by a lone parent. This is an increase of over 3,500 families since 2011. Almost 90,000 were single; a further 50,496 were widowed while the remaining 68,378 were separated or divorced.
- This represented approximately one in four of families with children and one in five of all families (25.4% of all family units with children in Ireland and 18% of all family units).
- 356,203 children lived in one parent families, representing more than one in five or 21.2% of all children in family units.
- The average one parent family has 1.63 children compared to an average of 1.95 for the population overall.
- The total number of divorced people in Ireland has increased from 87,770 in 2011 to 103,895 in 2016.This is an increase of over 44,000 people in the last ten years.
- In contrast, the number of people identified as separated has levelled off and stood at 118,178, up marginally from 116,194 five years earlier. As divorce in Ireland generally requires a period of separation in the first instance (up to five years) the figures reflects both a progression for people from separation to divorce, combined with more people becoming separated.
Source: Census 2016
Housing and Homelessness:
Housing and Homelessness
As of most recent data published by the Department of Housing, Local Government and Heritage:
-
In February 2024 there were 1994 families experiencing homelessness in the State, 73% of which are in Dublin. This is almost a 25% increase from February 2023, showing a startling rise in family homelessness in the past twelve months.
- One-parent families are disproportionately affected by homelessness. Despite making up just 20% of families in Ireland, one-parent families make up over 56% of homeless families.
-
These 1994 families include 3319 adults and 4170 children.
One-Parent Families and DEASP Payments
Below is the most up to date information on the One-Parent Family Payment (OFP) and Jobseeker’s Transition Payment (JST) since the recent OFP reforms, as well as other DEASP payments:
- The number of OFP recipients has decreased from 92,326 in 2010, before the reforms were announced, to 39,360 in 2020.
- The number of recipients of the Jobseekers’ Transition (JST) Payment has increased from 14,500 in 2017 to 15,533 in 2020.
- 54% (26,240) of all Working Family Payment (WFP) recipients are headed by a lone parent.
Source: Department of Employment Affairs and Social Protection – August 2020
Poverty and Deprivation Statistics
The Survey on Income and Living Conditions (SILC) results from 2021 showed that households headed by lone parents continue to be some of the hardest hit by deprivation and poverty, consistent with findings from previous years.
Lone parents are still struggling to meet the costs of living for themselves and their children. This includes the basics such as housing, food, heating and clothes. This is unacceptable and should not be normalised. Ireland is not a poor country and the government need to carefully consider the allocation of resources to ensure the most vulnerable are protected. There has been a minimal decrease in consistent poverty rates and more needs to be done to honour government commitments on child poverty.
How is ‘Deprivation’ defined?
Households that are systematically excluded and marginalised from consuming goods and services which are considered the norm for other people in society due to an inability to afford them, are considered to be ‘deprived’. This identification is currently achieved using a set of eleven basic deprivation indicators. Individuals who find themselves unable to meet two or more of the eleven listed indicators are considered to be experiencing “enforced deprivation”.
The deprivation indicators:
- Two pairs of strong shoes.
- A warm waterproof overcoat.
- Buy new (not second-hand) clothes.
- Eat meal with meat, chicken, fish (or vegetarian equivalent) every second day.
- Have a roast joint or its equivalent once a week.
- Had to go without heating during the last year through lack of money.
- Keep the home adequately warm.
- Buy presents for family or friends at least once a year.
- Replace any worn out furniture.
- Have family or friends for a drink or meal once a month.
- Have a morning, afternoon or evening out in the last fortnight for entertainment.
Deprivation rates for lone parents
- The proportion of people living in enforced deprivation increased from 13.8% in 2021 to 17.1% in 2022.
- Those living in households with one adult and one or more children aged under 18 has the highest deprivation rate in 2022 at 45.4%. This is up from 44.9% in 2021.
- This rate is 18.2% for households with two adults and 1-3 children aged under 18, meaning that one-parent families are approximately 2.5 times as likely to be living in enforced deprivation as two-parent families.
- Almost half of households (49.3%) said they had at least some difficulty in making ends meet in 2022, compared with 42.0% of households in 2021. This number is 73.7% for one-parent families, highlighting the need for more targeted supports.
- 21.5% of people living in one-adult households with children under 18 are unable to afford to keep the home adequately warm in 2022. This is up from 7.9% in 2021. The equivalent rate in for homes with two adults with 1-3 children is 6.4% in 2022, meaning that one-parent families are more than 3 times as likely to be unable to heat their homes.
- Persons living in single-adult household with children are almost twice as likely to be unable to afford new (not second-hand) clothes, compared with of two-adult households with one to three children. (26.4% vs 13.5%)
- 7.5% of persons with third level degree or higher were living in enforced deprivation, compared to 24.7% of those whose highest level of education is primary or below. This affects lone parents significantly, who are statistically less likely to hold advanced degrees, with 1 in 5 lone parents unable to access formal education due to the cost.
- People living in rented or rent-free accommodation are significantly more likely to be living in enforced deprivation, with a rate of 34.1% compared to 9.8% of those in owner-occupied housing. This disproportionately affects one-parent families, who are statistically more likely to be renters.
- The financial burden of housing costs is highest for those with children, particularly single-parent families. 59.5% of single-adult households with children regard housing costs as a heavy burden, compared with 39.2% of two-adult households with children, and 18.9% of households comprised of two-adults where at least one is aged 65 or over.
- Children are the age group most likely to be living in enforced deprivation. 20.1% of persons aged under 18 were living in enforced deprivation, compared to 10.9% of persons aged 65 and over.
Source: Survey on Income and Living Conditions (SILC): Enforced Deprivation 2022
At risk of poverty rates for lone parents
- “At risk of poverty” refers to households with incomes below 60% of the national median income, which is equal to €15,158 per individual per year.
- Nationwide, the rate of households considered ‘at risk of poverty’ was 11.6%. This is down from 12.8% in 2019, which indicates a positive change overall.
- In 2021, if all social transfers were excluded from income and using the standard at risk of poverty threshold (€15,158), the at risk of poverty rate would have been 38.6%. This highlights the importance of social transfers in keeping people out of poverty.
- The ‘at risk of poverty’ rate for households with one adult and one or more children aged under 18 was 22.8% in 2021. This is a decrease of 6.9% from 29.7% in 2019, indicating positive change overall.
- This figure of 22.8% for one-parent households is compared to a rate of 9.1% for two-parent households. This means that lone parents are more than twice as likely to be at risk of poverty compared to households with two parents.
- The report shows that minor positive change is happening, but not quickly enough. Time plays a role in poverty. We know that the longer any lone-parent family is exposed to an ‘at risk of poverty’ category, the more likely they are to start experiencing enforced deprivation. The two combined then force lone parent families into ‘consistent poverty’. Consistent poverty is living in a poverty trap, where the daily and weekly living is nearly always living on the back foot, never able to plan head, participate in social life easily, and are usually always in some type of debt.
- Further, data shows that across Europe, households with dependent children that are headed by lone parents are more than twice as likely to experience “in-work poverty”, meaning that they are falling below the income threshold despite being in employment. In 2012, 8.9% of working lone parents in Ireland were living in poverty; by 2017 this had increased to 20.8%. The rate of in-work poverty among lone parents was five times higher than other households with children (20.8% compared to 4.2%).
Consistent poverty rates for lone parents
- ‘Consistent poverty’ refers to a combination of both terms above, and thus refers to households with incomes below 60% of the national median income and also experiencing deprivation based on the 11 deprivation indicators.
- Households with one adult with children aged under 18 continue to have the highest consistent poverty rate among household types, at 13.1%. This rate is 3% for households with two adults with 1-3 children aged under 18. One-parent families are more than four times as likely to be living in consistent poverty as two-parent households.
Sources: SILC 2021, SILC Enforced Deprivation 2019, European Social Policy Network 2019.
Lone Parents and The Distribution of Wealth in Ireland
A TASC report published in December 2015 details the facts that one-parent families:
- Are less likely to own their own home and face significant barriers to owning property.
- Have business assets at 1/5 of the average rate of people in Ireland.
- Have savings of €300 on average, less than 10% of others.
- Have double the rates of debt to assets and are credit constrained at three times the rate of average households.
- Have an average net worth of seven times smaller than the average household. The average net wealth for a lone parent is €30,600 which compares to an average figure of €218,700 for all households. Further, half of all lone parents have less than €1,400 in net wealth.
Overall, the report showed clearly that one-parent families are significantly behind all other household types when it comes to wealth.
Source: TASC (2015)
About One-Parent Families in Education
From Census 2016 data, we can see the following re lone parents and educational attainment
215,781 lone parents were asked to state the highest level of education they had completed;
- 1.9% (4,160) had no formal education at all.
- 2.5% (5,289) were still in school or university.
- 13.8%(29,808) did not state their education or defined their status as “other”.
- 12.2% (26,250) stated that primary school was the highest level of formal education they had completed.
- 16.4% (35,299) stated that lower secondary school (Junior Certificate or equivalent) was the highest level they had completed.
- 18.7% (40,326) answered upper secondary school (Leaving Certificate or equivalent).
- 10.3% (22,265) answered that a technical/vocational qualification was the highest level of education completed.
- 4.2% (9,133) stated that it was an advanced certificate or a completed apprenticeship.
- 4.6% (10,028) answered that it was a higher certificate.
- 5.5% (11,762) stated that it was an Ordinary Bachelor’s Degree and/or professional qualification.
- 5.2% (11,230) stated that it was an Honours Bachelor’s Degree and/or professional qualification.
- 4.4% (9,454) answered that their highest level of education completed was a Postgraduate Diploma or Degree.
- 0.36% (777) answered that it was a Doctorate (PhD).
Source: Census 2016
About One-Parent Families in Work
The Households and Family Units breakdown of the Labour Force Survey released in October 2020 revealed the most recent employment statistics for the period April – June (Q2) 2020.
- In Q2 2020, the employment rate of lone parents (aged 15-64) was 60.7%, down 3.6% from 2019. This compares with employment rates of 76.9% (down 1.6%) for the adult members of couples with children, and 75.1% (down 0.7%) for the adult members of couples without children.
- The employment rate of lone parents (aged 15-64) whose youngest child was aged 0 to 5 years was 53.2% (down a significant 6.8% from 2019) in Q2 2020. This figure rises to 65.6% (down 1.9%) where the youngest child was aged 6 to 11 and falls back to 62.1% (down 8.8%) where the youngest child was aged 12 to 17. One possible explanation for this is that the increased cost of older children is making employment a necessity for more parents.
- 5.6% of lone parents were classified as unemployed in Q2 2020 (down 0.7% from 2019) compared to 2.4% (down 0.8%) of adult members of couples with children classified as long-term unemployed in the same period. A noticeable change from 2019 is the unemployment rate for lone parents with 3 or more children, which saw a large drop from 10.9% to 2.9%. This means that where before, lone parents with three or more children were twice as likely as those with one or two to be unemployed, they are now half as likely to be.
- On average, 58.7% (down 2.4% in 2019) of lone parents were participating in the labour market in Q2 2020. This compares with participation rates of 76.3% (down 1.9%) for the adult members of couples with children, and 49.4% (down 1.1%) for the adult members of couples without children. This dispels the myth that lone parents are not engaging in, and seeking, work outside the home.
- However, lone parents are much more likely to be employed on a temporary contract when compared to adults in two parent families (7.6% compared to 4.6%)
Source: CSO Labour Force Survey Households and Family Units Q2 2020
One-Parent Family Stats in Ireland by County
Stats by County as taken from Census 2016 update are available here.